
ECONOMETRICS IN SIMPLE WORDS
Don’t guess. Measure what really drives your business.
Every business owner asks the same question: “Why did my sales go up, or down?” Most of us answer with a guess. Econometrics answers with numbers. It uses your own data to separate what really caused a change from what only happened at the same time.
What is econometrics?
Econometrics is the use of statistics on real business or economic data to measure how one thing affects another: how price affects demand, how advertising affects sales, how interest rates affect loan repayment. The key idea is simple: look at several possible causes together, not one at a time.
A worked example: did the discount really raise sales?
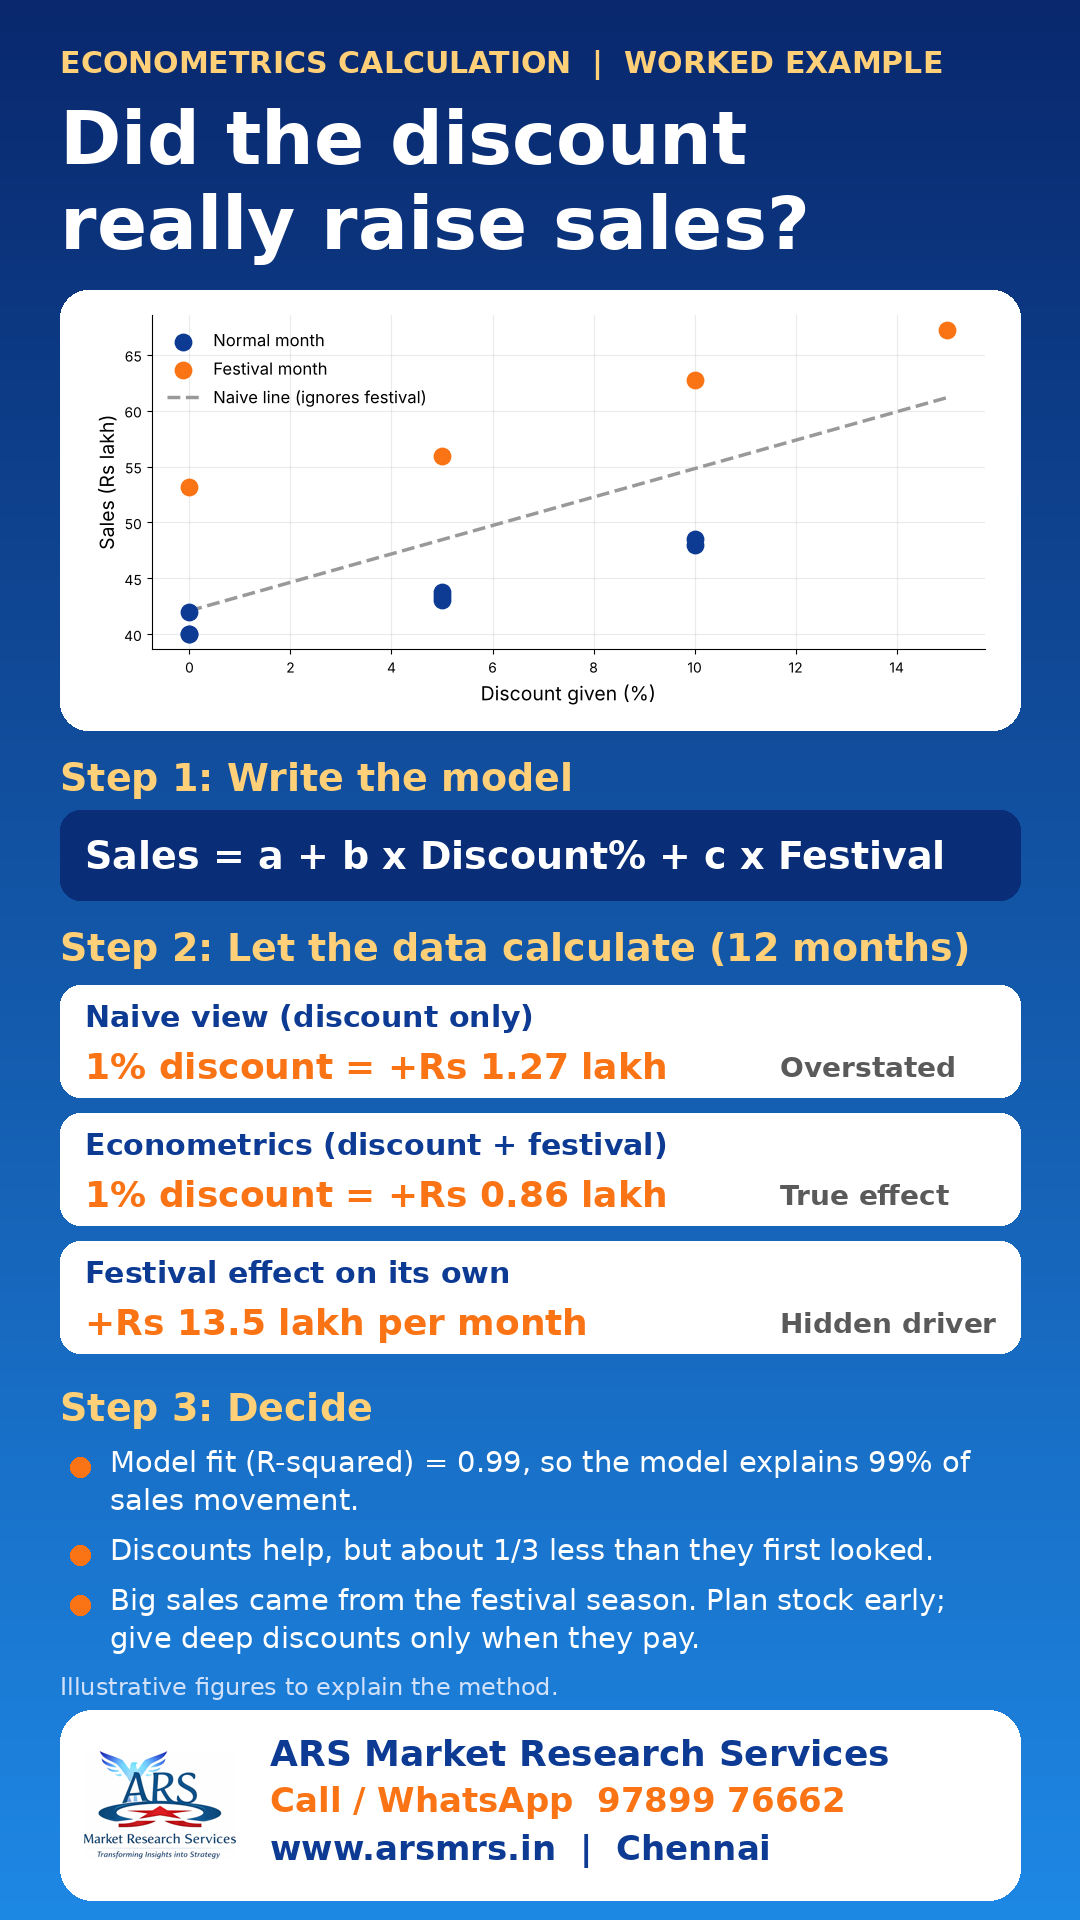
A shop gave discounts of 0%, 5%, 10% and 15% over 12 months. Four of those months were festival months. The figures below are illustrative, to explain the method.
| Method | Effect of a 1% discount | Festival effect |
|---|---|---|
| Naive view: discount only | + Rs 1.27 lakh | Ignored |
| Econometrics: discount + festival | + Rs 0.86 lakh | + Rs 13.5 lakh per month |
The model used is: Sales = a + b x Discount% + c x Festival. Looking at discount alone, it seems each 1% discount adds Rs 1.27 lakh. But the festival months also had the biggest discounts, so the discount was taking credit for what the calendar did. Once both are included, the discount is worth about Rs 0.86 lakh per 1%, about one-third less, and the festival adds roughly Rs 13.5 lakh a month by itself.
What the owner should do: plan stock early for festival months, and give deep discounts only where they pay for themselves.
Where business owners can use econometrics
- Pricing: how much will demand fall if you raise the price by 5%?
- Demand forecasting: how much stock to order for the next quarter
- Advertising: which channel really brings customers, and which only takes credit
- Credit and loans: which borrower factors predict repayment problems
- Budgeting: how sensitive your sales are to rain, festivals, fuel prices or interest rates
A simple checklist before you start
- Write the one decision you need to make (price, stock, budget).
- List everything that could plausibly affect the result, including season and competitors.
- Collect at least 12 to 24 months of regular data, such as a sales register.
- Run the model, then check it with common sense: does the direction make sense?
- Remember that a pattern is not always a cause. Test big decisions on a small scale first.
Common mistakes
- Crediting one factor for what two or three factors did together
- Using too little data, such as only 3 months
- Ignoring seasons, festivals and one-off events
- Believing a high fit number proves the cause
Frequently asked questions
Do I need to be an economist? No. If you have a sales register, you already have data. A researcher can run the model and explain the result in plain words.
Is econometrics only for big companies? No. Shops, small manufacturers and start-ups use the same ideas with smaller data.
How is it different from a survey? A survey asks people what they think. Econometrics measures what actually happened in your numbers. The two work best together.
Want this done for your business?
ARS Market Research Services, Chennai, turns your sales data and market data into clear decisions on pricing, demand and growth. WhatsApp 97899 76662 or visit arsmrs.in. See our business books at arsmrs.in/books, and official guidance at mospi.gov.in and msme.gov.in.